The “Issue analytics” report shows how many issues were opened and closed in each month of the specified period, and lists the issues of that period in decreasing order. The report is available for a group and for a project.
Report availability
The report is available to members of a group or a project with the “Guest” role and above, including those who hold that role in a parent group, and to users of the “Auditor” type.
In a group or a project with the “Public” visibility level, the report is open to any visitor, including one who has not signed in.
With the “Internal” visibility level, the report is open to any user, even one who is not a member of the group or project.
Viewing the report
To view the report of a group:
- In the top bar, select “Search or go to…” and pick the group.
- In the group menu, go to “Analyze” → “Issue analytics”.
To view the report of a project:
- In the top bar, select “Search or go to…” and pick the project.
- In the project menu, go to “Analyze” → “Issue analytics”.
The report is also available at a direct address:
| Report | Address |
|---|---|
| Group | https://<HOST>/groups/<GROUP>/-/issues_analytics |
| Project | https://<HOST>/<GROUP>/<PROJECT>/-/analytics/issues_analytics |
The report of a group covers the issues of its projects and the projects of its subgroups, except archived ones.
Chart overview
The “Overview” chart holds one column per month of the period, split into series:
- “Opened” — issues by the month they were created;
- “Closed” — issues by the month they were closed.
An issue created in one month and closed in another falls into both series, so a month can show more closed issues than opened ones. Months are counted in UTC, and a month with no issues is shown as an empty column.
The line above the chart sums up the period: Opened: 128 in total, 10.7 a month. Closed: 94 in total, 7.8 a month. The average is the total divided by the number of months in the period.
Reporting period
The period is 12 months, including the current one. To set another duration, add the months_back parameter to the address of the page:
https://<HOST>/groups/<GROUP>/-/issues_analytics?months_back=3The parameter takes a value from 1 to 36 months, including the current one. A value outside the range is brought to the nearest boundary, and a value that is not a number, to 12.
The caption under the horizontal axis names the period: Over 3 months (Jul 2026 – Sep 2026), and for a period of one month — “Current month”.
Filter bar
The filter bar above the chart narrows both the chart and the table:
- “Author” — one author;
- “Assignee” — one or several assignees;
- “Milestone” — one milestone;
- “Label” — one or several labels;
- “My reaction” — an emoji the current user reacted with;
- search field — search across issues.
Every filter except “My reaction” also accepts the != operator, which excludes the selected value from the report.
The filters and the period are kept in the address of the page, so a configured report can be shared as a link.
Issues table
The “Issues” table lists up to 100 issues created within the period, newest first. The line above the table shows how many issues are shown and how many match the filters: Newest issues of the period: 100 of 240. The total is counted up to 1000; past that the line reads Newest issues of the period: 100 of more than 1000.
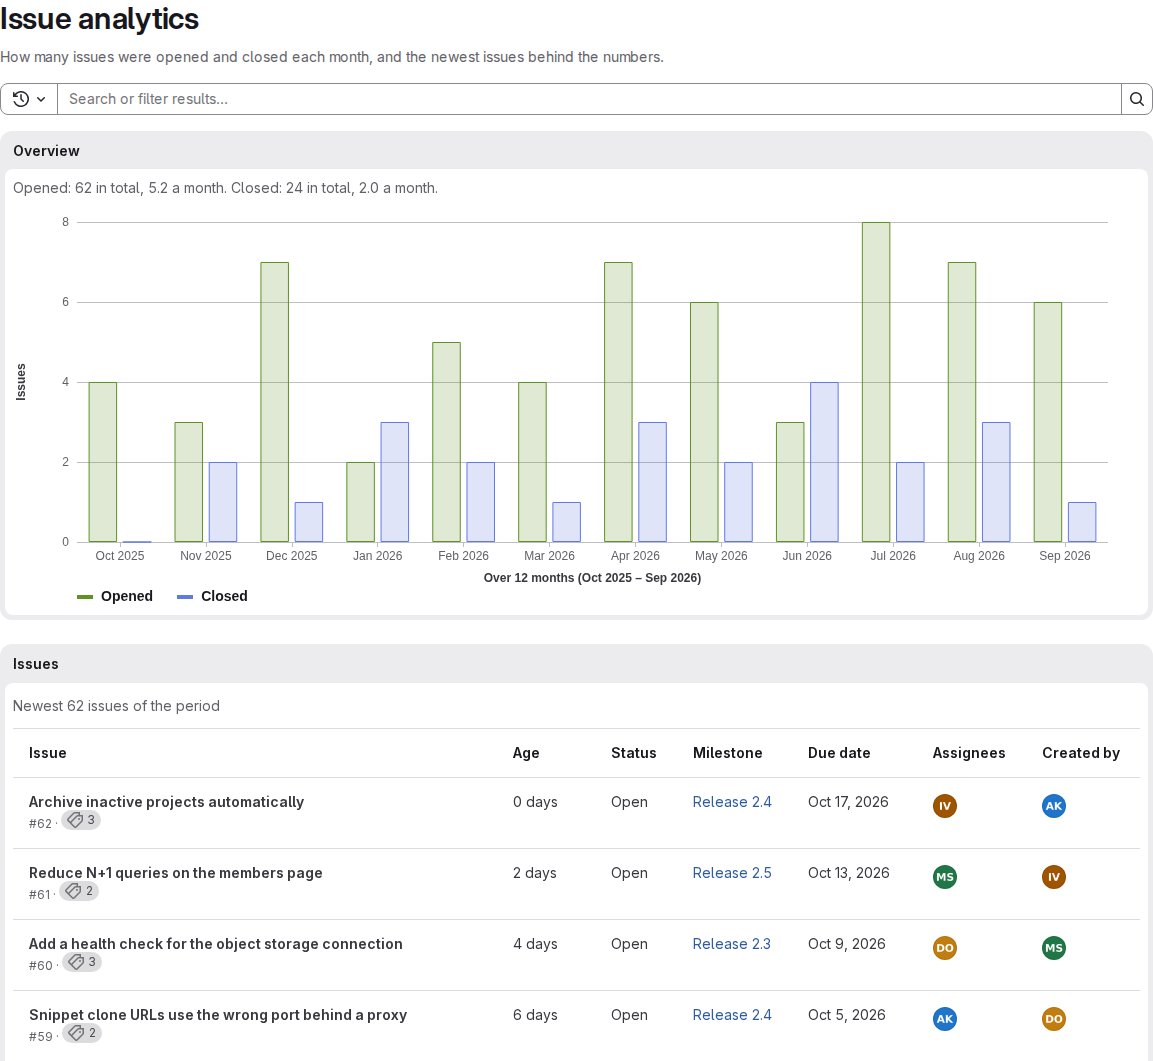
| Column | Content |
|---|---|
| “Issue” | Title with a link to the issue, its number, and the number of its labels. Pointing at the label count shows the labels, and selecting a label opens the issue list filtered by it |
| “Age” | Number of days since the issue was created |
| “Status” | “Open” or “Closed” |
| “Milestone” | Milestone of the issue, with a link to it |
| “Due date” | Due date of the issue |
| “Assignees” | Users assigned to the issue |
| “Created by” | Author of the issue |